Free operator resource
The Laundromat Profitability Cheat Sheet
These 5 metrics are what separate operators running six-figures from those stuck in the grind. Most operators only track 1–2 of these — and wonder why they can’t scale.
5 metrics · 10 minutes to set up · Track on the 1st of every month
Want the complete system behind these metrics?
16 operator documents + 8 online calculators. The documents explain how. The tools execute the how.
16 documents + 8 tools + 12 months access. Save $368 vs buying separately.
Revenue per Washer per Day
This is the cleanest measure of store performance. Count washers only — dryer revenue is included in gross but excluded from machine count. Below $8 means low turns, wrong pricing, or too many machines for the market. Above $15 means you’re performing well and likely leaving money on the table if you haven’t raised prices recently.
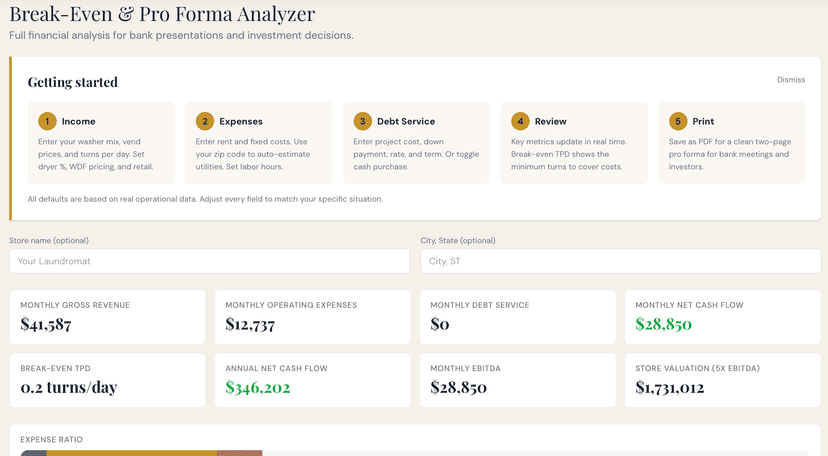
▶ Break-Even Analyzer calculates this automatically from your machine mix.
Utility Cost as % of Gross
The fastest signal that something is wrong. A slow water leak on one washer can cost $200/month. A water heater running too hot wastes gas every cycle. The CLA industry average is 21%. If you’re at 25% with newer equipment, investigate immediately.
▶ Utility Audit Tool tracks 12 months of bills and flags anomalies.
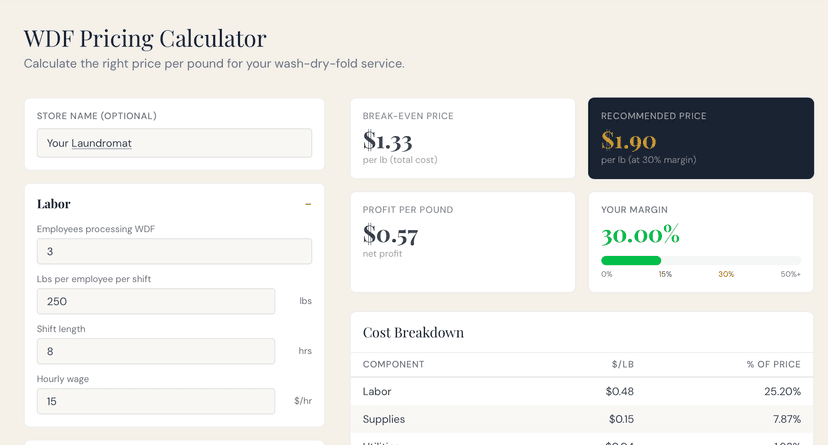
WDF Gross Margin
Most operators who run this number for the first time discover they’re making 15–20% — not the 30%+ they assumed. The gap is almost always underestimated labor. If you price WDF without accounting for fully loaded labor hours, you’re pricing below cost and calling it profit.
▶ WDF Pricing Calculator shows your exact cost per pound and recommended price.
Commercial Revenue %
A single dental office at $2.25/lb, 80 lbs/week = $9,360/year. It runs during off-peak hours, requires no marketing after acquisition, and rarely leaves once established. If this number is 0%, you’re leaving the easiest revenue in the industry on the table.
▶ Commercial Bid Calculator prices accounts based on your actual costs.
Net Cash Flow After Debt Service
Revenue is vanity. EBITDA looks good on paper but doesn’t pay your loan. This is the only number that tells you whether the business is actually working. If it’s negative, stop optimizing secondary metrics and fix this first.
▶ Break-Even Analyzer models your exact store and calculates break-even TPD.
Track these five numbers on the first of every month. Two data points give you a direction. Twelve give you the trajectory of your business.
The complete operating system
The cheat sheet teaches the metrics. The documents explain how. The tools execute the how.
Sell them separately and you’re missing the point. Together, they’re a system.
The Documents
Download, customize, print
- ✓Complete Operations Manual — Every procedure, standard, and script
- ✓Manager SOP — Decision authority, reporting, accountability
- ✓Attendant Shift System — 15-minute cadence, customer service
- ✓WDF Production System — Intake to delivery, quality control
- ✓Cleaning System — Daily, weekly, monthly protocols
- ✓Difficult Customer Guide — De-escalation scripts, refund procedures
- ✓Machine Maintenance SOP — Preventive care, repair logs
- ✓Owner Quick Start Guide — First 90 days, KPIs, equipment decisions
- ✓Employee Quick Manual — New hire reference, shift-ready in one read
- ✓Commercial Accounts Guide — Find, pitch, close B2B clients
- ✓Revenue Drivers Guide — Four revenue streams, benchmark mix
- ✓TPD Optimization Guide — Increase turns-per-day systematically
- + Training checklists, daily checklists, maintenance log, incident report
The Online Tools
Calculators that run in your browser
- ✓Break-Even & Pro Forma Analyzer — Model your store, see break-even TPD, print for banks
- ✓WDF Pricing Calculator — Input costs, get exact $/lb at your target margin
- ✓Vend Price Optimizer — Model price increases, see exact revenue impact
- ✓Monthly P&L Tracker — Track revenue/expenses monthly, spot trends
- ✓Commercial Bid Calculator — Price B2B accounts correctly, margin math automated
- ✓Equipment ROI Calculator — Know which machine upgrades pay off
- ✓Employee Cost Calculator — True labor cost beyond the hourly wage
- ✓Utility Audit Tool — Track bills, benchmark costs, flag anomalies
The Toolkit
$397one-time
16 documents, instant download
- ✓ Complete operations manual + 15 docs
- ✓ Customizable with your store info
- ✓ Instant download
- — Online tools not included
The Bundle
$497one-time
Documents + 12 months of tools
- ✓ All 16 documents
- ✓ All 8 online calculators
- ✓ Weekly newsletter
- ✓ 12 months included
- ✓ Save $368 vs separate
The Membership
$39/month
Tools + newsletter, cancel anytime
- ✓ All 8 online calculators
- ✓ Weekly newsletter
- ✓ Resource library
- — Documents not included
Free: The Laundromat Profitability Cheat Sheet
Five metrics every operator should track monthly. One page. Delivered to your inbox.
Already own the Toolkit?
Get access to all 8 online calculators + the weekly operator newsletter for $39/month.
Or get weekly operator insights delivered to your inbox:
Free cheat sheet
5 metrics every operator should track monthly.